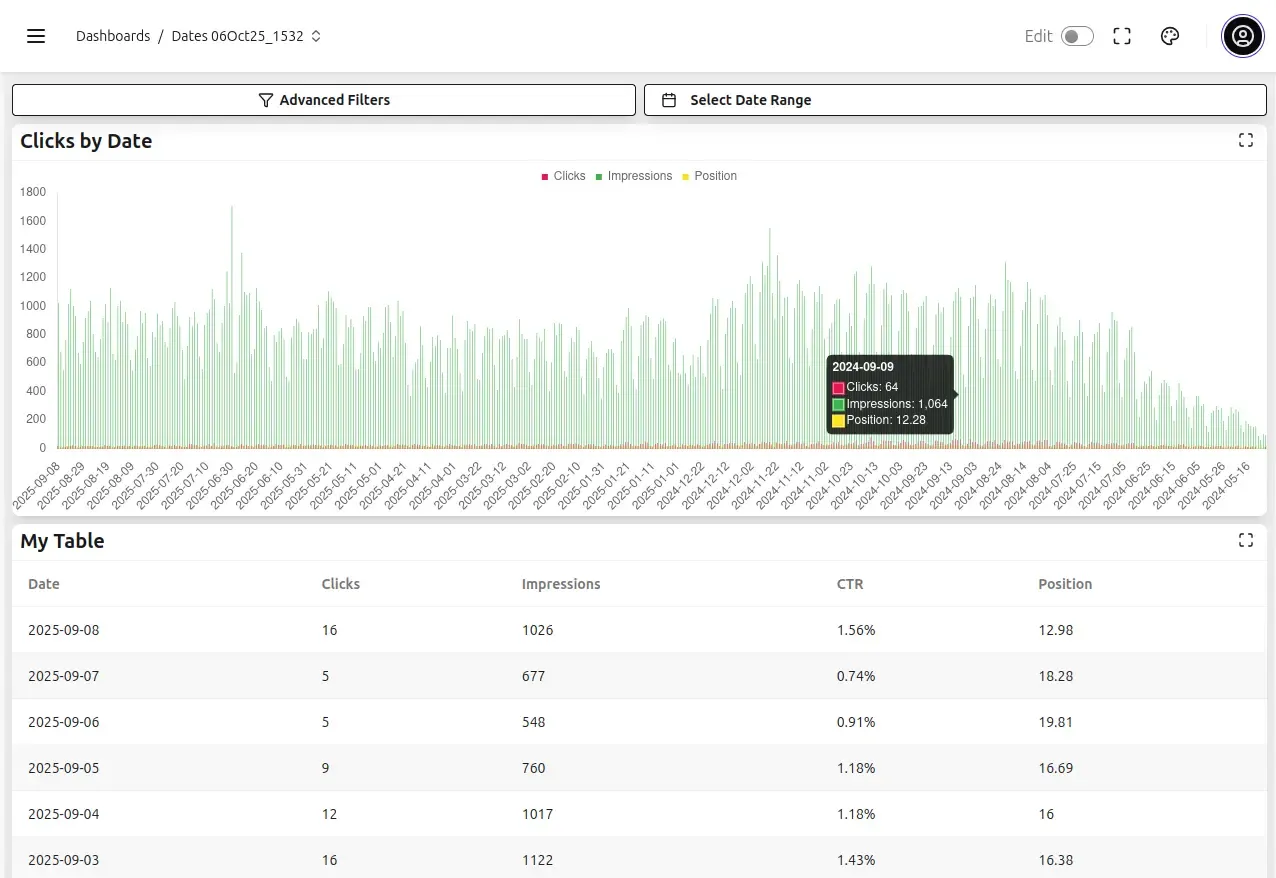
Turn Your Spreadsheets into Live Dashboards Instantly
Connect your Google Sheets or CSVs, and autogenerate beautiful, shareable dashboards. Tailor it to perfectly match your needs with our simple drag-and-drop builder.
If your data lives in spreadsheets, this probably sounds familiar...
Your Metrics Are Scattered in different tabs
Your key metrics are scattered across a dozen different places. You're constantly switching between your Stripe report, Google Analytics, and multiple project sheets just to get a complete picture. You can't see everything in one place.
You're Rebuilding the Same Reports Every Week.
Every week, you build the same report. You find your CSVs, you create the same charts, and you arrange them in the same layout. It's a manual, error-prone cycle that forces you to re-create your work from scratch every single time.
Creating same report in different formats?(pdf/live link)
You need to serve everyone, but their needs are different. Leadership wants a clean PDF for their slide deck, but your team needs a live, interactive link to explore the data themselves. This forces you to create multiple versions from the same source, doubling your work and creating a headache to keep everything consistent.
Connect, Build, Brand, and Share Dashboards Effortlessly.
Everything you need to create professional, data-driven reports, without the complexity.
Autogenerate Dashboards and Present with Professional Polish
Move beyond the default spreadsheet look. Autogenerate dashboards and impress your clients and stakeholders by customizing your dashboard with different themes. Create stunning, professional reports that look custom-built for your brand.
- Autogenerate dashboard from multiple Google Sheets & CSV files.
- Support for both locally uploaded and remote (URL-based) CSVs.
- Simple, intuitive drag-and-drop dashboard builder.
- Choose from multiple beautiful color themes
- White-label options available for agencies.
Build Once, Update Forever
Escape the repetitive report treadmill. Create your ideal dashboard layout just once. If your data is in a Google Sheet, it syncs automatically. For local files, simply upload the new version, and your entire dashboard updates instantly. No rebuilding charts, no rearranging layouts. Set it and forget it.
- Automatic, real-time synchronization for Google Sheets
- Schedule daily or weekly refreshes for remote CSV data.
- Instantly update dashboards with a new file upload while preserving your layout.
Share and Tailor Your Output for Any Stakeholder
From one central dashboard, serve every stakeholder perfectly. Share a live, interactive link with your team for exploration. Export a pixel-perfect, branded PNG for the meeting. Create stunning, professional reports that are ready for any audience, in any format, without re-doing any work.
- Easily share with invite link.
- Granular control over who can view or edit dashboards.
- Export any dashboard to a high-quality PNG image
Bring All Your Data Together Into One Unified View
Combine data from multiple sources whether it's Stripe reports, Google Analytics exports, or project tracking sheets into a single, unified dashboard. Build as many dashboards as you need for different goals, all organized and accessible in one workspace and eaisly switch between them.
- Connect multiple Google Sheets & CSV files in one dashboard.
- Track multiple dashboards from various sources in one place.
- Easily switch between different dashboards.
Get Started in Minutes
Follow these simple steps to transform your raw data into beautiful, shareable dashboards with EasyAnalytica.
1. Connect Your Data
Securely link your Google Sheets, or use local CSV files / public CSV URLs with EasyAnalytica.
2. Instant Auto-Creation
Watch as we analyze your data and automatically generate your initial dashboard in seconds.
3. Refine & Publish
Tailor your dashboard with our intuitive drag-and-drop editor, then publish it.
Built for Professionals Like You
Select your role to see how EasyAnalytica directly addresses your unique data challenges and simplifies your workflow.
Find the Perfect Plan for EasyAnalytica
Start for free or choose a plan that scales with your needs. Simple, transparent pricing.
Free Plan
Ideal for personal use & exploration.
- Dashboards from local CSVs or public URLs
- 1 Editor
- 10 Viewers (for public data)
- 10 Dashboards
- Manual Data Sync Only
Standard Plan
Perfect for growing teams & private data.
Locks in for 1 year. (Standard price $50/month after beta)
Everything in Free, plus:
- Connect private Google Sheets
- Automatic data refresh intervals
- Up to 20 total users (incl. 2 Editors)
- 500 data source syncs/month
Agency Plan
For agencies managing multiple clients.
Everything in Standard, plus:
- White labeling & custom branding
- Up to 100 total users (incl. 10 Editors)
- 1000 data source syncs/month
Frequently Asked Questions
Have questions about EasyAnalytica? We've got answers.
Currently, EasyAnalytica supports Google Sheets (public only), local CSV files and publicly accessible CSV URLs. We'll be adding support for private google sheets, S3/R2 object storage and direct API connections soon!
Yes, for optimal performance with EasyAnalytica, a single connected Google Sheet cannot be more than 2MB at this time.
No. While you can sort, search, and filter data within the dashboards, EasyAnalytica is designed as a powerful presentation and visualization layer for data already prepared in your spreadsheets. It's not intended for exploratory data analysis, for which teams usually have specialized tools.
Dashboards created with local CSV files are primarily for your own viewing, as you'll need to re-select the local file each time you open the dashboard in EasyAnalytica. For easily sharable and auto-updating dashboards, we recommend using Google Sheets or publicly accessible CSV URLs.
If you reach your monthly data source sync limit, automatic data refreshes for your dashboards in EasyAnalytica will pause until your next billing cycle. Your dashboards will remain accessible and will display the last successfully synced data.
Absolutely. We prioritize your data security at EasyAnalytica. We use secure OAuth2 for connecting to your Google Sheets, which means we never see or store your Google password. Your sheet data is temporarily cached on our secure servers solely to display your dashboards and is refreshed based on your sync settings. It is not stored permanently.
It is simpler to create dashboards with easyanalytica. While possible, it is difficult to customize layouts and create consistent branding with native charts. We're a platform for professional communication. Easyanalytica lets you combine multiple data sources, brand your reports with themes and colors, and share a single, live-updating link so everyone stays on the same page.
Looker is a powerful BI tool, but it has a steep learning curve that can take hours or days to master. Our platform is built for one thing: speed to a beautiful result. You can create and share a polished, professional dashboard in minutes, not hours.
An AI typically gives you one of two things: a static, one-time report or a block of code. The static report is outdated the moment it's created, forcing you to start a new request for every update. The code requires you to become a developer-maintaining servers, updating dependencies, and worrying about security.We offer a third, better path: a living, managed platform. You get a consistent, live, interactive dashboard that updates automatically, with zero code or maintenance required. We handle all the complexity so you can focus on the insights.
Not at all. Those are powerful, complex platforms for data science teams. We're proudly built for everyone else the manager, founder, or agency owner who needs to make their spreadsheet data look great and be easy to understand, without needing a data analyst.
It comes down to the job you need to do. General-purpose no-code tools are designed to help you build a custom application from the ground up. If you need to build a unique internal tool with complex logic and custom actions, they are a fantastic choice. Our platform is designed to help you communicate your data, instantly. We're not an app builder. We are a dedicated reporting and communication tool that focuses exclusively on the workflow of connecting spreadsheet data and presenting it beautifully. We trade the infinite flexibility of a general builder for world-class speed and simplicity for this specific task.
We don't change the data nor do we store it permanently. It stays with you. If you stop using the service you will only lose access to dashboards. Your data is intact, you are not locked
Ready to Transform Your Spreadsheets?
Join the EasyAnalytica beta and turn your data into stunning, insightful dashboards in seconds.
Lock in 50% OFF the Standard Plan for your first year!
(That's a $300 annual saving!)
No credit card required for beta access.